The day before yesterday, I reported that Briffa and Osborn (Science 1999) had not just deleted the post=1960 decline (see also CA here), but had deleted the pre-1550 portion as well – the deletions contributing to an unwarranted rhetorical impression of consistency between the reconstructions, an impression that was capitalized upon in the commentary in the running text of Briffa and Osborn 1999.
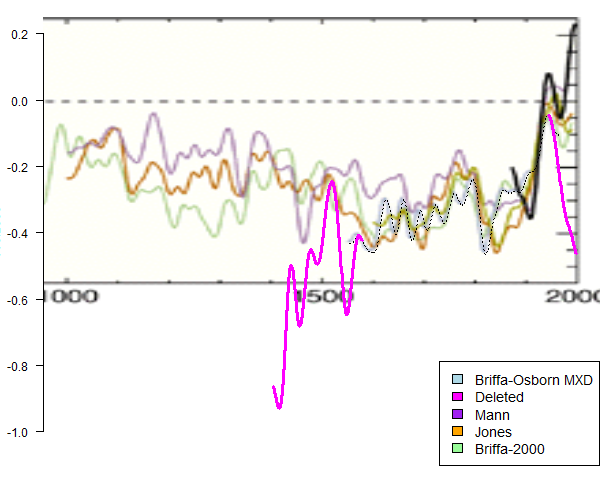
Figure 1. Annotated version of Briffa and Osborn 1999 Figure 1. See here and here for derivation.
The dossier of computer programs in the Climategate documents is far from complete – programs from Tim Osborn and Ian Harris are in the dossier, but not programs from either Keith Briffa or Phil Jones.
In the directory osborn-tree6, the program science99_fig1.pro both by its name and contents appears to be the program that was used to produce the figure in Briffa and Osborn(Science 1999) – see here for example, though the program in the Climategate zip file is not dated until Feb 16, 2000, about 9 months after the publication of the article.
But there’s an apparent curious inconsistency between the program in Osborn’s archive and the figure as published in Science (Update Mar 23 pm – reader PaulM has now traced the implementation of the deletion of pre-1550 back further).. Here’s the section of code in which the Briffa reconstruction is retrieved:
2: begin ; Age-banded MXD
alltit=”Age-banded density NH growing-season reconstruction”
; Period to consider
perst=1402
peren=1960
fac=0.0 ; do not smooth it any further!!!
; restore,filename=’../treeharry/densadj_all(330).idlsave’
; timey=x
; ; CONVERSION FACTORS FOR AGE-BANDED MXD, BY REGRESSION ON INSTR.
; ts=densadj*0.156525 ; converts it from density to temperature anom
timey=newagetime
ts=newagets
kl=where((timey ge perst) and (timey le peren),nyr)
timey=timey(kl)
ts=ts(kl)
; ts=ts(kl)-0.140369 ; to convert it oC wrt 1961-90
end
The start period for the reconstruction in the code is 1402 (the start of the magenta portion), rather than 1550 – the start of the Briffa version in the actual graphic.
It’s therefore evident that they had, at one time, plotted the Science 1999 spaghetti graph showing data before 1550, but elected to delete the pre-1550 data as well as the post-1960 data. I presume that there is another version of this program (with the corresponding line reading perst=1550) that was used to generate the figure in the Science article. It’s odd that it isn’t in the Osborn archive.
Update Mar 23 pm: – PaluM observes that the deletion of the pre-1550 portion can be accomplished through the parameter yrmxd, which proves to come from either the directory bandtempNHsm50_calmultipcr.idlsave or bandtempNHsm50_calmultipcr_NSIBhug.idlsave.
There is a parameter timey that is used to shorten the interval in the line
kl=where((timey ge perst) and (timey le peren),nyr)
This parameter timey is set to newagetime which is set to yrmxd in the second line of the code.
So to get the figure truncated to 1550, or any other start date you like, you can just run this code as it is with yrmxd set to whatever number you want, depending on how much data you want to hide from the reader. It is not really a code inconsistency.
The truncated time period newagetime is obtained in the lines:
[24] ;restore,filename=’bandtempNHsm50_calmultipcr.idlsave’
[25] ;restore,filename=’bandtempNHsm50_calmultipcr_NSIBhug.idlsave’
[26] ; Gets: nyr,nhtit,yrmxd,prednh,fullnh,predse
The directory bandtempNHsm50_calmultipcr_NSIBhug.idlsave results from a bodge that is mentioned in one of the programs – the age-banded NSIB series did not accord with expectations in some respect and, in some applications, the Hugershoff version was substituted for the age-banded version – as presumably in the directory referred to here.


194 Comments
Steve,
Thank you for your persistence in digging into this. I don’t know how many others I speak for but I really appreciate what you are doing.
I anticipate that they will initially ignore your findings and then come up some rationalisation. I wonder what they will dream up.
“Thank you for your persistence in digging into this. I don’t know how many others I speak for but I really appreciate what you are doing.”
Same here.
Thanks Steve.
ditto ditto ditto a million times
Huh. I wasn’t aware of the 2nd deletion.
If this isn’t pretty good evidence of scientific fraud, i don’t know what is. Unbelievable.
It’s not necessary for there to be another version. A parameter can be changed easily on the fly to generate a plot while the original program version stays in the archive.
Gavin referred to “Hide the decline” as a mathematical trick- something like L’Hospital’s rule. Edward Thorpe, author of “Beat the Dealer”, a winning strategy for blackjack, referred to ANOTHER mathematical trick used by
dishonest blackjack dealers. They peek at the next card- if the card helps the dealer, it is dealt honestly. If the card hurts the dealer or helps the opponent, the dealer deals out a “second” card underneath the top card. This mathematical trick helps the house win a higher percentage than chance alone, and causes the customer to lose a higher percentage than would result in chance alone. Gavin was right about the mathematical trick- from the above about dropping both post 1960 and pre 1550 data- they were using the mathematical trick developed by cheating blackjack dealers.
I suspect that any series that doesn’t go back to about 1000 AD, or else
ends early, say 1950 has been pruned to get rid of the “wrong” data. The
hunt is on now for series that are either missing, or have been truncated.
Hide the Decline is now Repeat the Delete.
I like that but would humbly amend to say “Repeat the Delete, and be Discreet.”
“… and especially you, Keet.”
I am certain I am not the only one to wonder if the pre-1550 deletion was done at the request of the editor of Science mag. It certainly does tidy things up a bit no matter whose idea it was.
The evidence seems to indicate cherrypicking of trees, cherrypicking of statistical methods, and cherrypicking of which parts of the outcome to show, all to produce the desired visual affect. The first two have been thoroughly dissected, and now the third comes under renewed scrutiny. Most striking to me is not what was done, but what was not done. Attribution is best done with objective logic trees. Has anyone tried (Craig Loehle, are you out there?) using the Schweingruber network or some other objectively gathered data set to pick trees that best follow the post-1960 instrument record, and see what they show about paleoclimate? Since the (circa) post-1960 temperature record is the most reliable, an objective approach that assumes temperature-dependent tree growth would entail looking at the trees that actually follow the most reliable data. I have been closely tracking this debate for a few years, but I do not recall this being done.
Re: Matt Skaggs (Mar 23 09:31),
That would be an interesting exercise, and it’s surprising that it hasn’t been done — kind-of “virtuous cherrypicking.”
The logical flaw is that, just because a given tree tracked the instrumental temps well form (say) 1950 to 1990, is certainly no guarantee that it did so earlier in its life.
snip
I don’t believe in tree rings enough to carry out this exercise. Trees grow in stands which will change their composition over time. No forest stand has ever maintained the same density for 1000 yrs because trees die. Precip changes affect the forest as well. The regional or individual standardizations done to factor out changes in growth with age are not valid in my view. The simple geometric effect of tree diameter is more justified but is not a strict function of age and is not used. I would classify this as an ill-posed problem: trying to do something impossible just because we would like an answer. Nothing I have seen from any dendro study convinces me that climate can be properly inferred from tree rings more than a few hundred years into the past, and even then we can’t tell which trees/stands will work a priori.
“I would classify this as an ill-posed problem: trying to do something impossible just because we would like an answer. ”
A very true statement, unfortunately guesswork or biased data usurps no data at all in an ill-posed problem, which is very much evident in climate science. A lot of the data is pure hocus.
You are far too kind. Isn’t it about time to declare dendrochronology about as scientific as astrology?
The width, density, etc. of tree rings depend on all kinds of conditions – amount of readily available moisture, soil nutrients, amount of sunshine, and on and on. Anyone who does not approach tree ring data with a great deal of skepticism is a fool.
Most here would agree with you, but please stick to the topic of this thread, namely the pre-1550 deletion in Briffa & Osborne, Science ’99
It has been a long time since CA has explained the problems with tree rings and despite the potential for confusion in the less informed, I’m sure you will agree that the quality of the data is rather central to the reasons behind the deletion.
The thread shouldn’t be sidetracked of course but Craig’s comment is central to the issue.
Matt, I would have thought that Briffa WANTED to have such trees in his studies. Schweingruber’s data certainly was a central focus of Briffa’s efforts, and if he still had to “hide the decline,” then doesn’t that argue that there simply aren’t any that match up with the post-1960 instrument data?
As I read the emails from that exchange, Briffa was stressed out from the pressure that Mann was putting on him, and if he had had some “cooperative” data to plop into the mix, I have to think his stress level would have been much lower.
I don’t mean to say it shouldn’t be looked at now, but I just get the impression that if Briffa couldn’t find it then, then probably none of the trees were “amenable” to what you are asking.
Steve:
You mention a “curious inconsistency” between Briffa -Osborn’s 1999 program and Science’s related graph. How about inconsistency between Briffa-Osborn’s 1999 and Briffa’s 2001 programs, or in the data used?
Your observation on March 21:
“Briffa et al 2001 uses virtually the same population of sites as Briffa and Osborn 1999. The B2001 population was 387 sites, while the Briffa et al 1998 (Nature 393) population (cited in BO99) was 383 sites – immaterially different.”
However, except for nominal intervals, graph results for 1999 (with pre-1550 data) and for 2001 diverge markedly before the year 1700.
Look a bit more closely at the code!
There is a parameter timey that is used to shorten the interval in the line
kl=where((timey ge perst) and (timey le peren),nyr)
This parameter timey is set to newagetime which is set to yrmxd in the second line of the code.
So to get the figure truncated to 1550, or any other start date you like, you can just run this code as it is with yrmxd set to whatever number you want, depending on how much data you want to hide from the reader. It is not really a code inconsistency.
Steve: thanks for noticing this. I’ll post this in the head post.
Re: PaulM (Mar 23 10:12),
PS in case anyone is wondering, the code in a language called IDL, a rather expensive commercial software package used fairly widely in academia mainly for graphical applications.
I take your point that “inconsistency” doesn’t really cover what’s being discussed, but it’s quite difficult to come up with a description that concisely expresses the concern.
I believe Steve’s main point in this case is that the source code indicates that the authors had examined the generated chart with the pre-1550 data included, and then made a conscious decision to omit the data, presumably using a different ephemeral and unrecorded version of the code presented here to achieve the desired result.
However taking your point into consideration, the range used here is guard code to ensure that none of the data pulled in via the yrmxd variable exceeds the bounds defined by perst and peren.
If the initial source of data didn’t include the pre-1550 data on the run in question, it wouldn’t matter if perst was set to 1402 or 1550; the result would have been the same.
You’d then have to ask why, who and how with respect to the data fed into the IDL code for the purposes of generating the graph of course. That moves the question a bit.
PaulM, Steve, re: newagetime
I’m not familiar with IDL, but having had a look at the language definition, I’m not sure newagetime is being used to control the left-hand truncation point.
The variables timey, newagetime, ts and newagets appear to be arrays, not scalar values. newagetime is an array of years (subsequently assigned to timey) and newagets appears to be the array of proxy T’s, which is then assigned to ts.
The line
kl=where((timey ge perst) and (timey le peren),nyr)sets kl to an array of indices into timey where the value of the elements of “timey” are in the range perst..peren (ie. where the condition in the ‘where’ argument is true).
The line
timey=timey(kl)then (re)sets timey to the array of elements specified by the array of indices kl. Effectively, the timey array is stripped of any years outside 1402-1960. The same is then done in the next line to the ts array (the Y elements of the X,Y plot).
The “restore” function restores saved IDL variables (or functions) from a previous session – the data arrays newagetime and newagets must have been prepared and saved from a previous session.
Steve: regardless of the precise programming tactic, they decided to delete the data from 1402-1550 at some point.
Ok, now I see mrsean2k has already pointed this out, more concisely too.
One thing that I’ve only just cottoned on to is how much more damaging the decision to strip the older data is to the credibility of the graph and it’s authors (I’m way behind everybody else I realise).
You can sort-of make a case that you “know” the divergence at the instrumental end is “obviously” an unquantified effect of industrialisation and so can be omitted; that is you could apply the most generous interpretation on motives and accept that they genuinely believe it’s justified.
You can’t do that with this new sin of omission.
For those of you who are well versed in IDL and have studied this code and other programs from Climategate, is it accurate to characterize many of these programs as being deliberately coded to falsify result data?
And by “falsify” I mean anything that deliberately omits or artificially modifies results, as well as creates fictitious results. Feel free to detail where you feel any specific code sample falls, be it omit, artificially modify, or fictionalize.
In this example, I gather that the issue is omitting results. It would be interesting to see a listing of all Climategate programs along with a description of the falsification (per my definition, or use your own), if any.
the British have given us Sherlock Holmes, Morse, Frost and other detectives who were extremely scientific and logical in their thinking, thereby solving crimes …
this sleuthing is from the same order … the evidence presented here (and before) is something way greater than compelling …
how can anybody still believe any graph, any conclusion, any theory from people who have practised “science” as has the Team ?
thanks Steve ! this is simply amazing …
In reference to Mann’s Trick….obliquely, yesterday’s Supreme Court ruling on Zicam (a homeopathic nasal spray) ruled in part:
Thus, hiding or omitting information, even if one feels it is ‘erroneous’ or ‘outlying’ (or whatever they claim) is still possibly fraudulent ( or in this case, scientifically improper) if it would ‘add to the total mix of available information’. Statistical significance is not to be the deciding factor.
This may be OT and I’m not a big Sotomayor fan,but this is clearly an example of cherry-picking or taking out of context. Read the whole article. it was a (rarely reported) unanimous decision.
There is a phrase for this behavior: falsification. It’s just another piece to the mountainous pile of evidence of research misconduct by the Team.
As I’ve discussed on my blog:
The climategate dossier was assembled to tell a story. For me, the real mystery has always been ‘what story was the leaker trying to tell us?’ What narrative could possibly tie together this particular set of emails and code? Why did he choose to include some emails and not others — what links all of these emails together?
I now think Steve (perhaps the only man with the patience, capacity and perspective to solve the riddle) is getting close. Its way more than simply removing post-1960 data. A picture is emerging of how data was manipulated to tell a ‘nice, tidy story’ and of how scientists were all too eager to please their funders by eliminating adverse data. Thanks to PaulM’s contribution, we now have the hide-o-matic in the code! I think the last four posts have been bombshells.
Hmmmmmm.
The hermetic climate code.
mpaul,
You said in your above comment, “””For me, the real mystery has always been ‘what story was the leaker trying to tell us?’ What narrative could possibly tie together this particular set of emails and code? Why did he choose to include some emails and not others — what links all of these emails together? “””
I see Steve mentioned in the main post, “””The dossier of computer programs in the Climategate documents is far from complete – programs from Tim Osborn and Ian Harris are in the dossier, but not programs from either Keith Briffa or Phil Jones “””.
The dossier of emails and documents that got (somehow) released from UEA/CRU appear to me to indicate more like a certain tendency of behavior by an association of scientists rather than a preselected set of coherent topical storylines. The releaser may have just wanted to say, ” . . . here are enough emails and docs to make reasonable people worry, puzzling out the detailed story is up to those worried reasonable people . . . “. If that is what the releaser was thinking, he was certainly right as shown by the CA efforts (and some other blogs).
John
Cherrypicking?
When did they start using cherry trees?
Down here in the Land of Oz, making false or misleading statements or declarations is an actual real live crime!
I know this is a serious topic, but the devil made me ask
“This parameter timey is set to newagetime…”
But is it sensitive new age time?
I will add my admiration of Steve’s persistence, thoroughness and clarity of thought.
May he long continue.
I agree with Craig L.
tree rings are not a valid indicator of past temperature.
Craig didn’t quite say that. The issue is what value do they add to the pre-thermometer record in terms of both coverage and precision.
Plaudits to Steve for keeping his eye on that damned pea!
Craig Loehle,
I do not blame you for not wanting to loiter on a dead end street. Belatedly tying my original comment (9th) into this thread, the magenta data suggests that standard deviation dwarfs actual signal for the trees of interest, when compared to other proxies. The best way to prove that interpretation would be to show that the best-calibrated trees in the same or similar datasets exhibit dissimilarity to both the cherrypicked trees and the other proxies. It would also do wonders to illuminate the suddenly looming question: Is there really such a thing as a “divergence problem?”
I’d say it’s more of a convergence problem. Trees only converge with temps irregularly.
Geoff:
It’s definitely new age (post modern) science!
An amazing group of posts! Thanks Steve.
snip – please avoid referring to politicians
I think it is clear now that they were not cherry-picking, rather that they were simply “fencing” — which is not a crime that I am aware of. So, clearly the accusations of “cherry picking” are simply unwarranted. Further it is obvious from the code that they were not “sitting on the fence” but rather it was an active process whereby they were able to build a fence at will — which is an active occupation rather than a passive one — showing their ambition to be at the forefront of the research rather than being bereft of results to show for their efforts. All in all, a jolly good show.
“Falsification is manipulating research materials, equipment or processes, or changing or omitting data or results such that the research is not accurately represented in the research record.”
So no. It’s not fencing (whatever that means). Its research misconduct.
John A appears to be quoting from the Caltech policy on research misconduct: http://futurehistoric.wordpress.com/2011/02/22/defining-research-misconduct/ .
Re WillR, what Briffa and Jones have done here might be called “lemon dropping” rather than “cherry picking”. In cherry picking, you only show the data that confirms what you are trying to prove, whereas in lemon dropping, you drop the data that contradicts it, leaving both the “good” cherry data and the noisy “apple” data that neither confirms nor contradicts it. Lemon dropping is a more subtle way of falsifying your data, since it’s not so obvious that it’s been manipulated.
In these two articles, the post-1960 and/or pre-1550 Briffa MXD data has been selectively lemon dropped, leaving a noisy but still coherent pattern to the data that is shown.
There’s also the interesting question of why the two versions of the “same” Briffa MXD data look so different, but Steve is apparently working on this.
So what’s “fencing”, and how does this differ from “lemon dropping”?
When the lemons fall off my tree, they don’t later jump back onto the tree.
What we seem to have here is parameterization of lemon-culling, to facilitate the tuning of which lemons to eventually drop.
I agree, that “fencing” doesn’t seem to capture the impropriety of setting up machinery to facilitate the optimization of the cloaked culling of lemons, that is, unwelcome data.
The coder here has set up a ‘knob’ to cull the data, and ‘knobs’ are meant to be adjusted.
Nothing in the programmer’s “comments” describes this pivotal activity of the code.
Worser and worser…
RR
John A and Hu McCulloch,
I may be wrong here, but I took WillR’s fencing comment to be an instance of argumentum ad sarcasm, a derivative form of reductio ad absurdum.
🙂
Re: Earle Williams (Mar 24 11:31), Somewhat guilty. But a grain of truth too. 🙂
A fence is just what it sounds like — with this data I will not go beyond the fence. Indeed there are times in engineering where it makes a lot of sense to stay within boundaries. You can get into situations where the data should be impossible and should be ignored. I think that in (research/investigative) science making a carefully constructed fence which you will not look beyond is indicative of something else. Indeed you should be looking for data which disproves your point. The you should uncover why it appears to disprove your point. In engineering of machinery and electronics we become curious about data which is impossible because it tells us that our design is operating outside the agreed upon (design) parameters. Then, to ignore the data is to invite problems — of many types.
So yes it would appear that they “fenced in” the data. And I have never seen any academic policy which really covers that as you can simply redefine the area of investigation to be within safe bounds — and hence always make your point. Researchers who always succeed certainly seem to get better funding than those who “go out of bounds” and have their research show to have “negatives”.
It is a perfectly legitimate machine/procedure design technique — but if they are not designing the temperature data then I don’t think it is needed.
Maybe that is more clear.
That would be a Whitewashed Fence in this case then.
How many Whitewash coats are needed to hide the data, well 4 coats and its still showing.
Re: JohnH (Mar 25 04:26), John, I take your point. 🙂
To me it is interesting that they rejected the data that perhaps could have proved their point — or not tis true.
As someone who has done a modest amount of fundamental research I find that good, well behaved data is “uninteresting”. It is the ill-mannered bad tempered data that appears to disprove your favored conjecture that is the most interesting… In this case we can establishes boundaries (or fences) at two locations and obtain three segments showing very different behaviors sets — supposedly all within the same data set. So you ask why? Then you have three sets of data perhaps the two at the edges are the proper system response — perhaps one in the middle. The you ask what supporting data you have that could possibly explain the “step functions” or disconnects in the system response. Here you might have to move from statistical analysis to other scientific data analysis is true, but the original analysis is what led you to the areas to investigate.
So, do you investigate what changed in the system? (as a scientist.) Are we looking at two periods of faulty data collection? One period of faulty data collection? Is it two periods of optimal growth? Is it one period of optimal growth. What other climate data can tell me why the “step” occurred at the boundary time?
Possibly analysis of other data at around those times would have pointed to an analysis that showed that what you were looking at was how that system responded when the “system/organism” was too hot, too cold, too dry, too wet, too variable or whatever. And that is where proper statistical and scientific analysis might have proved something. It was a lost opportunity. Is it “just one tree” — and hence of no true significance? Or was it one tree and of such great significance that we should change the world… Too many questions, too fats with the delete key — or perhaps I should say with the fencing.
Perhaps we need someone with rapier sharp wit to answer these questions. It won’t be me.
There is no fence here. A fence is when you have experimental parameters that define the population or process. For example, we might define patients over 300 lbs as not representative of the general population for our study. In the paleo case, they have a reconstruction method applied to a population of trees. Sometimes they exclude a site because it gets the wrong answer–without proving why. Sometimes they exclude a time period because it gets the wrong answer. It is post hoc removal of results they don’t like. If the method gives contradictory results with different populations of trees or in different time periods, it is a wonky method. Period.
Re: Craig Loehle (Mar 25 09:11), Craig:
I agree with you. I was trying to point out that there is a a “good” way to approach the inconvenient data and a “bad” way. Lopping off inconvenient data is “bad” I agree.
Establishing boundary points or fences where data becomes inconvenient is not in and of itself bad. Establishing those points to determine how to lop off an inconvenient truth so that you can sell your product or point of view is as you rightly point out quite a different issue.
If you are establishing these points to determine where the research opportunities lay — then surely that is a “good thing”.
Since I am agreeing with you, and value your opinions, and you are more knowledgeable than me and of more significant importance than me in the research community then that must be a “good thing” too. 🙂 …and I will leave this matter to people who know more that I ever could about such things.
Cheers and best wishes.
WillR. The overall standards are simply expressed by the requirements that statements are “full, true and plain” disclosure (using Canadian terminology) or even “the truth, the whole truth and nothing but the truth” as required by oaths in court. Its not complex.
Has there been any Team response to what have been accurately described as the bombshells of the last few of Steve’s posts?
From my perspective, with this example it appears they have crossed the threshold from simple incompetence and confirmation bias into the realm of academic misconduct.
Yes, but now that UEA has paid Muir Russell GBP 40K plus expenses to absolve Jones and Briffa of hiding any data, there is no point in complaining to UEA. Instead, RG and Science should be asked to retract the papers in question.
Watts
So what are you doing with your surface stations – selecting data drom sites you consider to be good responders. Just how is this different?
There is no comparison between what Anthony is doing and what Briffa et al have done here. Mr Watts is surveying the surface stations to ascertain which ones adhere to the required standards for an official weather station (you know the kind of thing – not to near an asphalt runway or an air conditioner outlet etc.)
Briffa et al have attempted to use subterfuge to “hide the decline” in their reconstruction post 1960, now it also appears they have tried to “obscure the rise” prior to 1550. Are you trying to justify this or do you just not like Mr Watts amd his websites relentless attempts to hold up a mirror to the face of climate science.
Ford,
First, go to the surface stations site and learn what the goal is and how it is being accomplished. The survey identifies which stations meet standards and which do not. You can tot up the do’s and do nots, and caluclate a ratio that very roughly gives an idea of suspicious you might be of USHCN processed and ‘corrected’ data. Nothing is thrown away, deleted, or hidden.
After that, come back, look at the graph showing the missing data and ask yourself, just what scientific goal could be accomplished by deleting between 31 percent of a data set that you purport (not you personally) to say supports your conclusions? In case you doubt this figure, there are 188 years of truncated data out of a span of 598 years: 148 off the beginning, and 40 off the end. Worse, no justification has been offered and the removals were not called out by the authors.
should read “… how suspicious …”
I’ll reply here but it will probably get pulled.
Watts is observing the current state of temperature proxies (LIG thermometers, Pt resistance thermometers, Thermistors etc in various enclosures. These all respond in a certain way to temperature – not always linear (lig will have a boiling point where it becomes decidedly non linear. They are all placed over different surfaces Snow, rain, grass growth, new tarmac, etc will all influence the air temperature measured.
Watts then removes manually any he considers does not CURRENTLY (and have not in the past?) meet the standards he is applying (cherry picking). This leaves the “good reponder” proxies.
All thermometers require calibration against kmown standards
Briffa does not have this luxury. His proxies are dead trees – there is no possibility of determining which are to be good proxies for their life. Rivers may change course affecting the water table. All trees have a inverted cup shape growth with temperature. There will be an optimum below and above which growth rates will be lower. This optimum will depend on available nutrients, surrounding competition etc. all of which will change over the life of the tree.
Trees need calibrating against known standards – the intrumental data.
McIntyre’s blog has already castigated Briffa for throwing away trees that are not good proxies (cherry picking). This leaves the good proxies. Briffa is now being called “names” for removing bad data that does not give a good proxy for temperature but which is taken from trees that for some of the period are good responders. This sounds very much like Watts is doing!
Re: thefordprefect (Mar 26 07:52),
You should have stopped there while you were ahead. But at least now the rest of us know the depth of your scientific acumen.
He’s not removing anything. He’s merely doing an analysis of the station quality and binning them based on pre-defined standards, standards that were set by those responsible for the stations in the first place. The standards have nothing to do with the outcome, just the quality of the siting. Apples and oranges. This was really an ignorant comment, prefect.
Mark
I suggest you look at this https://climateaudit.org/2009/09/30/yamal-the-forest-and-the-trees/
I was told you had to consider the whole population – no just the cherry picked one!
You are not helping your cause
Exactly, so the result should not be dominated by one tree in the population, like Yamal is. Yup, you chose a poor example.
Of course he did. He doesn’t even understand what it is he is defending.
Mark
Surface Stations — and even Yamal — are way off topic on this post.
Please stick to B&O Science 99, folks.
Should probably pull TFP’s original OT and all replies.
It never ceases to amaze me how much importance mankind has been willing to give to a (now bogus) graph that shows a left hand side Y axis that is less than .6 degrees in scale (showing .2 degree increments). It’s bad enough that the scale is so small without now also having to take into consideration how badly some of the (deleted now resurrected) data fits (doesn’t) the story (once “scientific fact”, now “fairytale”).
Steve,
Not the best place for this link I know but given that peopel will be reading this thread as I am having come here from WUWT, may I draw your attention to the folowing comment I’ve posted on DITC that concerns PSU ESSC.
I was originally researching Amy Luers but subsequently stumbled upon Eric Barron (http://www.joss.ucar.edu/cwg/jun08/bios/barron.html).
“He served as chair of the Climate Research Committee of the National Research Council (NRC) from 1990 to 1996. In 1997, he was named co-chair of the Board on Atmospheric Sciences (BASC) of the NRC, and since 1999 he has chaired the BASC”
and
“Barron went to Pennsylvania State University in 1986 to direct the College of Earth and Mineral Sciences newly formed Earth System Science Center (ESSC). In 1989, he was promoted to professor of geosciences. Under Barron’s leadership, the growth of ESSC resulted in the establishment of the College of Earth and Mineral Sciences’ Environment I nstitute, which included ESSC and a group of other research centers. Barron became the director of this new Institute in 1998. He earned the title of distinguished professor in 1999. In 2002, he was named dean of the College of Earth and Mineral Sciences at Penn State.”
Now I’m sure we all know who the current Director of PSU ESSC (founded by Eric Barron) is (http://www.meteo.psu.edu/~mann/Mann/index.html). Could this be a case of the student following in the footsteps of his mentor/master? I’ve always wondered how a certain paleo-climatologist managed to appear from no where and become the icon he became so quickly?
There are three possibilities: 1) the early portion had bad fit to the data, which calls into question the method, 2)the early period didn’t fit the narrative or 3) the sample number was not adequate during the early period. Is there any evidence it was 3?
In the preceding post, Steve observes that the sample does get quite small prior to 1550:
This might have been a valid reason to drop the pre-1550 data, had it been clearly stated, but then why is Briffa 2001 relying on the same “inadequate” sample?
Readers may recall that the Loehle and McCulloch (2008) corrected no-treering reconstruction terminates in 1950 (1935 after tridecadal smoothing), when the sample of proxies drops to half its full value of 18. See http://econ.ohio-state.edu/jhm/AGW/Loehle/ .
Briffa doesn’t have much of a history to demonstrate that he worries about sample sizes. YAD06 comes to mind…
The OB99 graph has upturning slope (as compared to Steve’s trace)on BOTH ends.
Any thoughts on this? I am wondering if this most likely caused by end-padding?
If so, it is adding insult to injury to truncate data on both ends of a sequence and then artificially end-pad as if there was no data on either end.
McIntyre
Not being a user of IDL, I cannot be sure, but dont commented out lines start with a semi colon. In which case why are you quoting them in your post as being used to get newagetime?
Or are you getting back to the age old accusations that commented out lines COULD have been used?
In which case why are you not complaining about all the lines deleted the could have held proof that temperatures are really falling!?
Clearly commented out lines WERE used at one point or another. Such practices means it’s easy to do another run by uncommenting one line and commenting out another.
Does anyone think this line looks odd??
Steve: I’m not troubled by this per se. Prior cal was 1902-1980 reference period.
Not odd at all, it just translates the entire curve down by 0.14 degrees C. From the comment, it appears that this line would be used to convert the reconstruction to anomalies with respect to a baseline period 1961-90; that is, relative to the average temperature in that interval. The line above it, without the offset, presumably computes a reconstruction of anomalies relative to a different average temperature.
But, 1961-90 were the years deleted in the original “hide the decline”. I guess that’s why it jumped out at me.
Good point — How does one adjust a series to have a zero average during a subperiod that has been deleted? If the deleted data was used, then it can’t have been “wrong”.
Conceivably the two versions of the Briffa series were calibrated to instrumental data up to 1960, and then adjusted to be relative to an instrumental base period of 1960-91. But it’s worth checking.
Steve says the original calibration was relative to 1902-80. But was this done using the deleted 1960-80 portion of the data, or was it just done relative to instrumental data that averaged to zero in this period? (The deleted data, according to Steve, actually continues to 1994 or so, so in any event some of it was omitted for this calibration.)
Hu, in climategate email 0939154709 (where Osborn is sending a revised reconstruction to Mann to replace the one used in the TAR zero order draft) Osborn comments to Mann about calibration of the series wrt 1881-1960. However, Osborn/Briffa feel that since the instrumental series are calculated as anomalies wrt 1961-90 that their reconstruction can therefore be expressed the same way.
Here is the relevant passage:
The Briffa series as used in the TAR spaghetti graph was offset (upward) somewhat from the climategate version which Osborn initially sent to Mann based on 1881-1960. However, it would seem that Osborn’s email gave Mann the green light to pick a different calibration/alignment period and still call it 1961-90. If I have calculated correctly, calibrating to 1931-60 would have offset the Briffa series upward from the 1881-1960 alignment by about 0.13C but according to Osborn’s logic would still have been expressed as 1961-90 anomaly.
Incidently, the alignment of the Briffa series in TAR does not match 1881-1960, nor the alternative 1931-1960 calibration as suggested by Osborn. Nor is it based on the difference between instrumental means of 1961-90 and 1881-1960. Whatever it was, there is obviously no better alignment for endpoint coherence and rhetorical effect then the offset Mann chose.
Struck me too. I was going to ask if the early year graph shape was affected or caused by a calibration based on the 1961-90 record, using in whole or in part the later year portion since deleted. Lacking time to investigate it myself, I’m wondering if it’s a valid possibility.
Steve, this is classic work. Unbelievable scientific sleuthing. Thank you. Personally, I feel a debt of gratitude. I’ve already begun schooling my 9, 7 & 6 year old grandsons to the debacle of AGW… Oh, & the decline of the polar bears!
My immediate thought was, however, what idea do you or others have on the basel integrity of all the other series? They all seem so well behave wrt the objective of the Braffa, Mann & Jones objectives? Those were untouched? Really?
(Please snip if off topic)
Th word “decline” occurs 46 times within the osborn-tree6 directory:
C:\!FOIA\documents\osborn-tree6\mann\oldprog\maps12.pro
C:\!FOIA\documents\osborn-tree6\mann\oldprog\maps15.pro
C:\!FOIA\documents\osborn-tree6\mann\oldprog\maps24.pro
C:\!FOIA\documents\osborn-tree6\mann\oldprog\mxd_eof_rotate.pro
C:\!FOIA\documents\osborn-tree6\mann\oldprog\mxd_pcr_localtemp.pro
C:\!FOIA\documents\osborn-tree6\mann\oldprog\mxd_pcr_modesslp.pro
C:\!FOIA\documents\osborn-tree6\mann\oldprog\mxd_stp_modes.pro
C:\!FOIA\documents\osborn-tree6\mann\oldprog\olat_stp_modes.pro
C:\!FOIA\documents\osborn-tree6\mann\oldprog\pl_calibmxd4.pro
C:\!FOIA\documents\osborn-tree6\mann\oldprog\pl_decline.pro
C:\!FOIA\documents\osborn-tree6\mann\oldprog\pl_mxd_stp_modes.pro
C:\!FOIA\documents\osborn-tree6\mann\oldprog\testeof.pro
C:\!FOIA\documents\osborn-tree6\summer_modes\brambatti_f6ab.pro
C:\!FOIA\documents\osborn-tree6\summer_modes\calibrate_correctmxd.pro
C:\!FOIA\documents\osborn-tree6\summer_modes\calibrate_mxd.pro
C:\!FOIA\documents\osborn-tree6\summer_modes\data4alps.pro
C:\!FOIA\documents\osborn-tree6\summer_modes\data4sweden.pro
C:\!FOIA\documents\osborn-tree6\summer_modes\funct_decline_matchvar.pro
C:\!FOIA\documents\osborn-tree6\summer_modes\funct_decline_regress.pro
C:\!FOIA\documents\osborn-tree6\summer_modes\maps12.pro
C:\!FOIA\documents\osborn-tree6\summer_modes\maps15.pro
C:\!FOIA\documents\osborn-tree6\summer_modes\maps24.pro
C:\!FOIA\documents\osborn-tree6\summer_modes\maps_general.pro
C:\!FOIA\documents\osborn-tree6\summer_modes\mxd_eof_rotate.pro
C:\!FOIA\documents\osborn-tree6\summer_modes\mxd_pcr_localtemp.pro
C:\!FOIA\documents\osborn-tree6\summer_modes\mxd_pcr_modesslp.pro
C:\!FOIA\documents\osborn-tree6\summer_modes\mxd_stp_modes.pro
C:\!FOIA\documents\osborn-tree6\summer_modes\olat_stp_modes.pro
C:\!FOIA\documents\osborn-tree6\summer_modes\pl_calibmxd4.pro
C:\!FOIA\documents\osborn-tree6\summer_modes\pl_decline.pro
C:\!FOIA\documents\osborn-tree6\summer_modes\pl_mxd_stp_modes.pro
C:\!FOIA\documents\osborn-tree6\summer_modes\testeof.pro
C:\!FOIA\documents\osborn-tree6\summer_modes\old\calibrate_mxd.pro
I Randomly picked 3 files from the 1999-2000 time period, (out of curiosity):
————————————————————————–
funct_decline.pro 9/13/1999:
pro funct_decline,x,a,f,pder
;
cval=0.251499 ; need to update to ensure a smooth join
z=x-1930
f=cval+a(0)*z+a(1)*z*z
;
if n_params() ge 4 then begin
pder=[[z],[z*z]]
endif
;
end
——————————————————————
calibrate_correctmxd.pro 9/13/1999:
; We have previously (calibrate_mxd.pro) calibrated the high-pass filtered
; MXD over 1911-1990, applied the calibration to unfiltered MXD data (which
; gives a zero mean over 1881-1960) after extending the calibration to boxes
; without temperature data (pl_calibmxd1.pro). We have identified and
; artificially removed (i.e. corrected) the decline in this calibrated
; data set. We now recalibrate this corrected calibrated dataset against
; the unfiltered 1911-1990 temperature data, and apply the same calibration
; to the corrected and uncorrected calibrated MXD data.
——————————————————————
test_of.pro 8/15/2000:
; Computes EOFs of infilled calibrated MXD gridded dataset.
; Can use corrected or uncorrected MXD data (i.e., corrected for the decline).
; Do not usually rotate, since this loses the common volcanic and global
; warming signal, and results in regional-mean series instead.
; Generally use the correlation matrix EOFs.
;
Don’t know if it’s worth anything, but there seems to be a treasure trove of information contained within the comments at the beginning of the code in each file.
Nice find. Did you search for other keywords, such as divergence or diverge?
Because of other work I have not been able to appreciate your diligence properly. I am left wondering if it links to the Steve article before this one, in which I give a long email 1123513957.txt that concludes with the team being presented with 3 graphs and the invitation to ‘take your pick’ (for the 2007 IPCC).
There are 3 file names given for the graphs but no attachments, so I don’t know of they are recoverable. Some digging might be rewarding. They are
>Attachment converted: Macintosh HD:mwpbox8502000.pdf (PDF /«IC») (00091133)
>Attachment converted: Macintosh HD:mwpbox8501500.pdf (PDF /«IC») (00091134)
>Attachment converted: Macintosh HD:ipccar4_mwpbox 2.pdf (PDF /«IC») (00091135)
My mind cannot get around the presentation of 3 graphs and the invitation to take your pick. Like saying “This aircraft has a critical take-off speed. Here are three velocities, one of these might work, take your pick”.
That’s not science. That’s cartooning.
I’ve done some parsing of these files and grep’ed the files for keywords as well.
There was some discussion of them in the immediate wake of climategate, but it takes a while to see what’s going on with them. I’ll post on them some time.
The programs describe a sort of bodge – compare the bodge in Briffa et al 1992 – and discussed from time to time here.
Osborn testified to the Parliamentary Committee that he(Osborn) didn’t use the bodge in his published papers. I’ll discuss this in more detail on another occasion, but, as usual, you have to watch the pea carefully.
However, Osborn didn’t say that no one at CRU used a bodge. Briffa didn’t testify on this point. Briffa used a bodge in the Tornetrask reconstruction, originating in Briffa et al 1992 and applied in many CRU papers.
In addition, the fact that Osborn didn’t use a bodge in papers from 1999 on isn’t quite as innocent as it appears (or as argued by defenders at the time.) In spaghetti graphs after Jones et al 1999, instead of bodging the data to hide the decline, CRU deleted the adverse data to hide the decline.
So technically it may be that they didn’t use the bodge in papers after 1999. They had a new trick – deleting the adverse data.
“Readers may recall that the Loehle and McCulloch (2008) corrected no-treering reconstruction terminates in 1950 (1935 after tridecadal smoothing), when the sample of proxies drops to half its full value of 18.”
Readers may also recall that Loehle and McCulloch (2008) do not have an adequately large sample size to call it a global temperature reconstruction, particularly in the southern hemisphere where 3 sites are used to represent the whole hemisphere. Can we take 3 thermometer sites across the SH and call it the SH temperature? no… there’s a reason this analysis wouldn’t have passed peer review standards at somewhere like GRL…
Steve – this has nothing to do with the present thread.
1) The reconstruction was an exercise to see what happens when tree rings are not used. I never claimed precision.
2) Two of the series used are themselves composites. Viau is derived from pollen records across all of North America. the China composite uses 8 series.
3) If people posted their data as the journals request when they publish, my job would have been easier and would have used more data.
Steve – please debate this paper on one of the related threads.
Steve,
Where does the data you have used to add the pink curve back to 1400 come from?
Steve linked to the data on a post a few days ago. It is the second sheet of the Excel file from here:
ftp://ftp.ncdc.noaa.gov/pub/data/paleo/contributions_by_author/jones1998/jonesdata.xls
Thanks so much Steve for continuing to fight for the truth. I can’t help you (or anyone) with the science but I damn sure can do my part with a bit of cash. I certainly hope that thousands of others will do the same. It’s vital that we all do our part in turning this tide. A few bucks to PayPal is my version of the modern Victory Bond and I’m hoping that you are our Churchill.
Thank you Mr. McIntyre.
Very interesting.
Are you sure that the data plotted is correct?
The initial temperature rise plotted between 1400 and 1550 for the purple line labeled deleted Briffa series seems to indicate that during this time period a significant temperature rise occurred.
The rate of rise for this time period seems to match the current rate of rise as depicted by the instrument record between ~1900 and 2000.
The industrial revolution did not start until ~1800.
Very interesting.
Julian:
The underlying problem with your question is assuming that the plotted tree ring widths have ANYTHING WHATSOEVER to do with temperature.
Post 1960 tree ring widths go DOWN as instrumental temperatures go UP. What does that indicate about actual temperatures?
from RC:
A single line in the IPCC AR4 report (p466) which correctly stated that “Wahl and Ammann (2006) also show that the impact [of the McIntyre and McKitirck critique] on the amplitude of the final reconstruction [by MBH98] was small (~0.05C)”
is that assuming that MM05 was a recontruction, rather than an attempt to replicate MBH99 ?? the ol’ smoke and mirrors i read about in montfords book?
Thanks again Steve. Unfortunately it seems that real malfeasance was afoot. This begs the question, who released the climate gate info? Despite multiple investigations, we still don’t know. And who is Harry?
Esper seems to have a heap of thoughtful papers on the subject of increasing the quality of this type of science.
http://www.geo.uni-mainz.de/esper/pub.html
The paper below seems to have something to say on the divergence issue.
107. Esper J, Frank DC (2009) Divergence pitfalls in tree-ring research. Climatic Change 94, 261-266
Click to access Esper_2009_CC_PIT.pdf
(106 is interesting as well!)
So you’re saying there wasn’t a MWP?
Who are you talking to? This thread speaks towards a specific temp reconstruction that has been butchered to reflect the whims/predelications/biases of the intrepid scientists who are at the center of the global warming lie.
Throwing up, out of the tip of your fingers, some specious unrelated remark towards something no one is talking about in this thread is really nonproductive.
Were wishes servers,
Man with the big red letter;
Would or would he hide?
=============
Bewildered lobes
Turn wine to miracle water.
Calyces excrete.
==========
Hi, Steve.
As a sometime lurker who came here first in 2005, I’ve been wondering what your purpose is, if it’s changed. You took an interest in Mann 98. Nine years down the track there have been many papers from different groups using different methods and proxies that generally converge on the conclusion that the (NH/global) temperature of the last few decades is likely warmer than for any similar period in the last millennium.
What is the purpose of your deconstructions? Do you have a larger agenda in mind so that I can read you in the right context?
Here’s just one author’s (LJUNGQVIST) opinion on this subject, from one of the papers on your first link.
“The 20th century warming (IPCC 2007) is apparent to different extents in
most, but far from all, records. Late 20th century temperatures are in some of the records the highest for the last two millennia, although more records seem to show peak medieval temperatures exceeding the modern temperatures.”
I don’t know that this author’s opinion would be exactly summarized thus
“…. the last few decades is likely warmer than for any similar period in the last millennium.”
When you compare results using one methodology then late 20th century doesn’t appear such a standout from the MWP. Paste the instrument record on the end of the graph and I agree you get a very convincing graphic, some dislike this behaviour though. If the paleo data alone supported your position I would probably have to agree with you. As things stands it doesn’t and so I’ll maintain my right to be sceptical.
This really begs for an inspection of the other dendro studies as well. I’d be amazed if using the same tree rings and given the interaction of the team memebers (as outlined in the Wegman report) that the other results really varied that much from Briffa’s.
It’s a couple of days since the original post, how long is a decent interval to expect the authors to formulate a response?
Should ‘Science’ magazine be formally approached, it is perhaps unreasonable to expect them to respond to a blog, but a letter from Steve would require some sort of action – at least a published editorial comment acknowleging the issue? Perhaps, if all else fails, a short paper along the lines of ‘A fuller analysis of available data undermines the conclusions of Briffa 1999’ It would be interesting to see what peer review made of it, and the potentially uncomfortable position that may put the editors in.
To my eye, when the whole curve is looked at in relation to the others, if one were to invert the sign and adjust for some lag, the fit would be better amongst the others. Is this another upside down case?
If one inverted the sign then the pink line would move from ranges of changes -0.05 to -0.9 to ranges of 0.05 to 0.9 and none of the other graphs go into the positive end of the spectrum. This would match the graph much less. how do you want to say that it is a case of upside down?
I would have expected the calibration process to move the pink line down as well as inverting it.
Maybe time to do a throughout methodical analysis of comments in temperature adjustment programs
I have looked at the data referenced on the NOAA site – It is interesting that the text file of the “same” data does not contain the second sheet of the excel format.
The heading for this second sheet is simply
Year Jones et al Mann et al Briffa et al
How is it possible to deduce what this data is – pre-publication? Intermediate files? Unprocessed data?
I’m sure you can point out the provenance of this data which enables your followers to prove nefarious activities.
Using the excel data and removing the filter shows a completely different curve to your pink variety.
The MXD data swings wildly between 0 and -1C ending in 1400 at -.2C – Choose the filtering to prove what you will.
Ever tried Hodrick-Prescott filtering Smooths reasonable end points retains sycronism with the unfiltered?
Mr Ford Perfect has posted a new spaghetti graph
on his blog. He EMPHATICALLY says that Steve knows not what the correct data prior to should or could be.
Another spin, or some justification in his commentary?
Ford:
I know what McIntyre is emulating. I was simply suggesting that HP filtering SEEMS better than averaging with missing data and end points.
I still want to know what McIntyre believes is the provenance of the data he started with. Perhaps he has a better reference for its source rather than a unreferenced page in excel which does not appear in the text format of the main data and which has no description.
It seems a bit much to create all this furore on the use of data discovered on the back of a cigarette packet!
Well, if you think an ftp on a NOAA website is the equivalent of a cigarette packet, maybe we ought to rethink who’s behaving like the tobacco industry.
Sounds like a good question for Jones, Briffa, Barnett & Tett, who submitted it to NCDC in the first place. When you find out from them, let us know!
Meanwhile, Steve has shown that it visually matches the published series in Briffa Science 99, when smoothed with the smoother Briffa says he uses, and with standard CRU endpadding. If Briffa with Jones submits a series to NCDC that they identify there as Briffa et al, and it matches a graph in a subsequent Briffa et al paper, it must be the same series.
How Briffa constructed it, why he deleted the post-1960 and pre-1550 portions, and why it doesn’t come close to other verions of the same series are questions for Briffa to answer, not Steve.
Meanwhile, Steve is probably in Chicago competing in the squash tournament, so if may be a couple of days before he catches his breath!
“Steve has shown that it visually matches the published series in Briffa Science 99”
except of course it does not have the data to 1550!
So we have data that is similar to but not the same as B1999. So what is this mysterious data – It may be the same, but perhaps it did not have full rocessing performed – who knows, I certainly do not!
So your working hypothesis is that data on an NCDC/NOAA FTP supplied by Briffa and Jones has nonsense data included that wasn’t worth publishing?
You’ve got it backwards — it [the NCDC XLS file] does have the data before 1550, as well as after 1960, while the Science graph unaccountably excludes it.
If you can find out why this part of the data was hidden in the Science graph, please let us know!
Why was the pre-1550 data excluded? You don’t know? I would have thought this was a question worth pursuing before making public accusations…
I would have thought it was an issue that should have been addressed when the paper was published. That’s the whole point, isn’t it?
Why should we have to guess? Wasn’t the obligation with the authors to clearly state why some data were used and others were not in enough detail so that people wouldn’t have to be guessing a dozen years later?
Hold it, the XLS file contains 2 sheets the first is relevant to the jones paper. The second contains some data pretty much unreferenced. The same directory contains a file of text data:
ftp://ftp.ncdc.noaa.gov/pub/data/paleo/contributions_by_author/jones1998/jonesdata.txt
LIST OF FILES: readme.jones1998.txt (this file),
Jonesdata.txt (tab-delimited ASCII text), Jonesdata.xls (Microsoft Excel).
DESCRIPTION:
Temperature sensitive paleoclimatic multi-proxy data from 17 sites worldwide
were used to generate thousand year long records of temperature for both hemispheres.
Proxy types include tree rings, ice cores, corals, and historical documents.
Data Files: Jonesdata.txt and Jonesdata.xls contain the original series in
normalised units as well as anomalies in Degreees C vs 1961-90 mean.
Can you see any reference to data contained in the second sheet? Do you KNOW the provenance of the second sheet data?
If you do know then why do you not clear this all up and simply state the relevant information.
If you do not then perhaps the mob brandishing scythes and pitch forks at the UEA gates should be stood down!?
Terato roamed with
Weather beaten, stitched up face.
What the Puck? We shout!
===============
“Can you see any reference to data contained in the second sheet?”
Yes. The entire xls file is referenced, not just sheet1. Maybe you should ask NOAA what sheet two represents instead of throwing spitballs here.
I am not the one using the data – it is McIntyre.
Why didn’t he ask NOAA before writing this piece. It is up to him to research his blog comments NOT me.
Sheet 2 data is attached to the xls. It is NOT in the text – I’m sure you can understand this. It is not referenced in the atrribution files. It may very well represent genuine tree ring data. I do Not know. But I would like to see a reference in the folder containing the file before I used it to start a ill conceived case against Briffa.
I’m sure McIntyre can lay this to rest and point to the provenance behind this data. I would have hoped he had provided this before the accusations started
Pardon me for being blunt, but this is ridiculous. Demanding Steve McIntyre establish the provenance of data climate scientists archived seems rather absurd. This is especially true since the data in question isn’t necessary for McIntyre’s point. Even if he couldn’t establish the provenance of any data on the second sheet, so what? How exactly would that affect the data from the first sheet? It wouldn’t. The second sheet can be completely ignored, and McIntyre’s comments would be unaffected.
That said, the provenance of two of the columns is fairly clear at this point. The “Jones et al” column is obviously just a truncated version of the third column of the first sheet. The provenance of the Briffa et al column was established as well, though just how that particular version came to be is still a mystery (the fault of which lies entirely with the authors, not McIntyre). https://climateaudit.org/2011/03/17/hide-the-decline-sciencemag/
I suspect it would take little effort to verify the provenance of the Mann et al column, though I lack the relevant data files to do so myself. Of course, neither the provenance of that column nor the others needs to be established for McIntyre’s points to be true. As such, demanding people discuss them is just a form of misdirection.
No, sheet2 is not “attached” any more or less than sheet1 is. There are both part and parcel of the xls. I’m sure you can understand this. Well, actually I’m not sure you can, or want to.
BS
The 2 series are not the SAME. They may be from the same base data, but one is filtered more than the other so there are discrepancies of up to 1C between them.
What filtering or other criteria are applied? What else is changed?
You are comparing unknown data with referenced data. This is nothing to base these accusations on.
I await MvcIntyres references to the real data.
thefordprefect, the only two series I said were the same are obviously the same. Anyone can look at the two and see there is no difference, other than the fact one is a truncated version of the other. If you are talking about the same thing I am, you’re claims are completely false. If you’re talking about two other series, you’re going to have to explicitly state which ones you’re referring to and explain just how they are relevant to anything I said.
Moreover, you have still made no effort to show how that second sheet is relevant to anything Steve McIntyre has said. I can’t see anywhere he has used that sheet for anything, and you haven’t provided any examples.
Quite frankly, nothing in your comment makes sense.
Re: thefordprefect (Mar 27 01:23),
I put some ideas on the provenance of this data in a post below.
Donation to follow, great work Mr McIntyre, please keep digging. Thanks for sterling effort.
Ther Ford Prefect is well known to most of us here in the UK. I have seen him on many blogs for avery long time. He has in the past qualified easily as a troll. Apparently he is now stepping up to challenge Mr McIntyre. He will be eaten alive if Mr M can be bothered with him.
David Jay
Posted Mar 25, 2011 at 11:32 AM | Permalink | Reply
Julian:
The underlying problem with your question is assuming that the
Post 1960 tree ring widths go DOWN as instrumental temperatures go UP. What does that indicate about actual temperatures?
David:
That would be the point.
My understanding is that a fairly lame excuse was used for justifying the omission of the post 1960 data, along the lines of the divergence being caused by some unknown human facto.
That excuse can’t apply to the 1400-1550 data.
The idea that tree rings can serve as a temperature proxy is refuted by this data. This makes all of the tree ring temperature proxies essentially useless. The 1950-1960 data calibration period becomes a random occurrence.
The hockey stick not only has no blade, it has no shaft.
Millions of dollars, wasted.
You suppose that the graph should be turned upside down. But it can’t. The treemometers aparrently fail during climate optimums.
The simple conclusion is that treerings are no good as temperature proxies. If the necessary assumption is that the temperature-sensitive trees are at the local limit for survival, then the idea is logically suspect: in times of locally or globally improved climate these trees are no longer living at the extreme limit and may respond instead to precipitation, sunlight, etc.
Isn’t it really the same – or equivalent – data as those in Mann’s “censored” directory?
Those people are dirty, indeed.
A bridge too far.
One supposes that the deletions were in malice.
In Geophysics we look for patterns.
They can be spatial.
They can be temporal.
In the instance of the spaghetti graph above, there was a nice piece of temporal correlation.
Once a temporal corrlelation is identified, it is natural to isolate and look for spatial evidience over the same period. That is just what Briffa and Osborn did.
What happened after that, who manipulated and extrapolated those results, is NOT the point of this thread IMHO. The scientists did what they should… what any scientist would. To accuse them of anything else is hindsight, and hindsight is speculation at best.
Hengav,
In geophysics we don’t ignore or delete the patterns that question the correlation. In fact, I always stress that patterns, as well as models, are most useful when they fail, because that tell us about the areas that we do not understand, and that is where we should be asking questions, not hiding them.
Dendrophrenology. Similar to dendrochronology only with more massaging of the data.
Ford correctly queries the provenance of this data. There are some puzzles about it, which I think at tAV (with suggestion from Romanm) have been answered.
The origin of the 1400- period begins with the 1998 paper in Nature
“Influence of volcanic eruptions on northern hemisphere summer temperature over the past 600 years”
As the title suggests, the paper is primarily about identifying eruptions with spikes in the record. That paper describes the extent of data:
“All chronologies cover at least the period 1891–1973 but many are much longer (for example, there are 287 back to 1800, 159 to 1700, 75 to 1600 and 8 back to 1400).”
So indeed, data is skimpy early on. For the purpose, this doesn’t matter much. A spike is a spike. So they performed a scaling which kept the variance more or less constant. This adjusted data is shown here, and plotted in their Fig 1.
But the variance adjustment can’t be used if you want to properly estimate the NH temperature. So they needed to go back to the unadjusted data calculated for that paper, which is the data that turned up in the Jones XL file.
But the severe reduction in data near 1400 is a big problem. So they started from a period when they had enough data to avoid spurious oscillations.
My question to Steve and others is – would you be happier if they had used that skimpy data to create a curve going back to 1400 in the Science paper? Or would there be a different lot of complaints?
The comments at tAV are worth reading.
Personally I would be happier if they had explained exactly what they did and why. Then we would not be speculating about it 12 years later.
Right, like YAD061.
Re: Jeff Alberts (Mar 27 20:01),
Well, is that what you’d like to see?
No, and that’s not what appears to be the case here. Yad061 was a single tree having undue influence over the rest of the data in the set. If the pre 1500 data is sparse, that doesn’t mean it’s un-usable.
The Yamal data was also sparse, and should not have developed a hockey stick since only one tree displayed that tendency. That was clearly abuse of the data.
Interesting Nick. I understand there is a 50 year low pass filter on the data. So given that there was a paucity of data prior to 1600, the data from 1550 to 1650 would contain signals from the insufficient 8 chronologies (could you define a chronology?) Why is 1550 to 1650 included in the graph (especially data pre 1600s) if it is carrying statistically invalid data, but then not the equivalent pre-1550 data? it seems to me there is only one answer. The post 1550 period is congruous with the message, but pre 1550s data is not.
Re: Ed Barbar (Mar 27 21:27),
Ed, this site used a 50-yr filter. Briffa used a 20-yr filter. But this is just the same question – where do you start? Now I suppose you’ll say, if pre-1650 is no good, then you can’t use 1700 – and so on.
No, I think they decided that 1550 was the year at which the data as presented, filters and all, was sufficiently free of low-sample spurious variability to be presented. And Steve’s graph supports that. Do people actually believe that the 15th century really went haywire, and that just happens to coincide with the sample dropoff? Or is it just another stick for beatibg Briffa with?
Steve: NIck, the problem with your argument is – and I pointed this out in an earlier post – that Briffa et al 2001 presents a reconstruction back to 1400 using the same network. If Briffa was bothered by low samples in Briffa and Osborn 1999, then he should have been just as bothered in Briffa et al 2001.
And if he was bothered by low samples in the MXD network from 1500-1550, as you say, then he should have rejected the Yamal chronology.
Nick,
According to this paper:
Click to access %20cook2004.pdf
Briffa used a 50 year filter.
And the answer about what should have been graphed is obvious. If, as you claim, pre 1600s data is not reliable, then it should not have been used, period. Why then is some of the pre 1600s data used, but not all?
And isn’t it odd that the data that WAS used is congruous with the message? And the data not shown is NOT congruous with the message? Given Briffas replacement of his non-congruent post 1960s tree ring data, the simplest answer I can think of is the pre 1550s graph, like the post 1960s graph, is simply not congruous with the message and so was eviscerated.
Since some of the pre 1600s data was used, there at least ought to be an explanation why only some of it was used, don’t you agree?
Ed Barbar,
It is not that pre-1600s data is unreliable it is that the sample size beyond that point is too small to be able to sufficiently deal with the subject. The confidence with the reconstruction going back that far is obviously not sufficient and that was why it was excluded. It is like anything, using global temperature measurements we could go all the way back to the 1700s but our confidence would be so far reduced that it is not worth plotting. Do you expect Cru, GISS and NOAA to plot going back that far or would u not agree that it is reasonable to only show data when your sample size is sufficiently high.
Your interpretation is not “simple” it is biased. Your comments implicitly show a pre-conceived bias against the authors of this data. That to me doesn’t seem very scientific…
Ed Barbar,
I should also note that it could be due to the spatial distribution being insufficient prior to the 1600s also.
Ed,
Well, yes, in the Science paper a 50-yr filter was used. In the earlier Nature paper it was “bi-decadal”.
I don’t recall mentioning 1600. But data doesn’t suddenly switch from being reliable to unreliable. Going back in time there’s less of it, until you start to get silly results, as this post shows. At some stage, someone has to decide when to stop.
There is a paper by Briffa in Quaternary Reviews 2000 which goes into much more detail about the datasets. About one (Tervagatory) they say:
“Note that, although the whole series is plotted here, the authors consider replication to be too poor before 1550 to be reliable.”
Nick,
Your quotation: ““All chronologies cover at least the period 1891–1973 but many are much longer (for example, there are 287 back to 1800, 159 to 1700, 75 to 1600 and 8 back to 1400).”
And your statement: “So indeed, data is skimpy early on.”
The implication is pre 1600’s data is “skimpy.” If not, I would like to know why at the precise point where the data diverges from the message, does the data get truncated. It’s too convenient.
Re: Ed Barbar (Mar 28 00:13),
Ed, what’s the message? And please back up your assertion about the precise point.
The precise point is that YOUR point that the data prior to 1550 was not included because it was “skimpy” isn’t reasonable. The data before 1600 wasn’t reasonable either, yet it was included. So including 1550 to 1600, and smoothing the post 1600 data is wrong in the Briffa graph according to your own reasoning.
In other words, your point isn’t a point at all.
Re Nick Stokes
Posted Mar 27, 2011 at 11:39 PM | Permalink | Reply
***I don’t recall mentioning 1600. But data doesn’t suddenly switch from being reliable to unreliable. Going back in time there’s less of it, until you start to get silly results, as this post shows. At some stage, someone has to decide when to stop.***
You say it doesn’t suddenly switch – so can you explain why it was cut off in 1960 – lack of data??
Robert,
“It is not that pre-1600s data is unreliable it is that the sample size beyond that point is too small to be able to sufficiently deal with the subject. ”
That’s fine. Then the 1550s to 1600s data should have been removed completely. It wasn’t. Regarding your “bias” assertion, I claim that excluding unwanted data from the paper is quite consistent. After all, the post 1960s data was truncated, and the actual land temperature data was grafted on to the tree ring data in Briffa, as I understand it. Isn’t an interpretation that other inconvenient data is deleted consistent with that behavior?
Re: Robert (Mar 27 23:22),
In scientific discussions, it is usually the case that a person should inform themselves of the facts of the situation before commenting on an issue. It appears that you don’t see this as a prerequisite.
If you had bothered to look at the Science 1998 paper, you would have seen Figure 2 which shows the number of chronologies available for analysis at various times. By counting the red dots in the plot at the upper left, you would find that there are more than 20 (I count at least 23) which are available by 1500. and more than 50 by the time you get to 1600. On what scientific basis do you claim that a set of 20 chronologies is “too small to be able to sufficiently deal with the subject”? Perhaps you have seen the data? I would think that 1500 could have been a reasonable starting point if not for those inconvenient low values you could see in Steve’s plot.
What particular insight do you have for stating in no uncertain terms “that was why it was excluded”? Was it a private communication from the authors?
Furthermore, you would also have noticed that by 1500, the spatial coverage included four of the five spatial regions defined with the first appearance of data from the fifth region coming only after 1600.
Ignorance may be bliss, but making it up as you go along doesn’t do anything for your credibility.
Re: RomanM (Mar 28 06:26),
Note also that in that 1998 paper they refer several times to specific data points from the 1400’s, in Table 1 and in the text. In particular they highlight the cool year 1453 and match it to a volcano. So at least in that paper they thought the 1400s data was valid. But a year later it didn’t look so good, so it was deleted.
It would be wrong however, to call this cherry-picking. It is in fact, according to Briffa et al 1998c (Phil Trans Roy Soc v353 p65)
“judicious sampling, and the use of rigorous statistical procedures“.
Re: PaulM (Mar 28 07:29),
No, that’s the point about the provenance of this data. They compiled an average (which is what Steve found), compiled for that 1998 paper, which showed features which seemed to match volcanic eruptions. For that purpose, it isn’t necessary that the average is fairly representative of the NH, or that there are enough samples in the dataset so that trends can emerge relative to noise. They aren’t looking for trends.
But if you want to use that data to fairly represent NH temps and their multidecadal trends, then the requirements are different. Steve is apparently prepared to do that, although I don’t think he actually looked into the amount of data that was supporting the average. Briffa et al weren’t, and they knew how much data was available.
Steve: Nick, once again, this is disinformation on your part – disinformation that I’ve already responded to. You have no evidence that the reconstruction wasn’t shown because of insufficient data. As I pointed out to you previously, Briffa et al 2001 reported pre-1550 values with no material increase in pre-1550 data. And there is far more data for Briffa MXD pre-1550 than there is for Yamal.
No Steve, the failure of evidence is on your part. You have said that the deletion was “to give the impression of “corroboration” of the “general validity” of the reconstructions.”. All sorts of charges have been made on the basis of that, but you give no evidence that that was the reason.
True, I don’t have direct evidence that the plot was terminated at 1550 because the number of samples was diminishing. But it was diminishing, as they reported, and that would be a perfectly normal reason for stopping at that point. Yamal may have used less, but it was not the sole basis for a NH reconstruction. If you want to claim impropriety, you need to show that your version is the correct one.
The paper you come back to, BO2001, cites a different and more recent source paper, B2000. It isn’t clear that they don’t have more data. But even if so, they make clear that they are using a different process designed more for the purpose than the data you have picked up compiled for the volcano paper, and they allude to this directly:
“So while these reconstructions have proved valuable for studying climate variability and the role of various forcing factors acting on relatively short timescales, such as volcanic eruptions [Briffa et al 1998a], they are of limited use for judging the warmth of 20th century warmth in a multicentury context.
…
For this reason, we propose a different approach to capturing long-timescale, in this case temperature, variability in these data.”
Steve: Nick, again, you continue to disseminate disinformation. The data version that I illustrated here was a different version than the one used in the volcanic paper. If you don’t know things, please don’t assert them categorically.
The “process” used for the Briffa version in the Jones et al 1998 archive – what Lubos aptly calls the “censored” data –
illustrated in the present graphic was age-banding, not Hugershoff, as you falsely allege.
As I pointed out before (which you failed to respond to), if the pre-1550 data was insufficient, then why was a pre-1550 reconstruction presented in Briffa et al 2001? That was why I raised the question. You have not responded to this point, instead making unsupported assertions.
Re: Nick Stokes (Mar 28 23:34),
Steve, I have indeed responded to that point. I typed out the section of BO2001 where they explicitly said the earlier reconstructions, like B1998a (the paper referred to, with the Phil Trans paper, as the source by BO99) are of limited use for judging the relative magnitude of 20th century warmth. And they assert that BO2001 has a better one. That seems to be a valid reason for going back further in time.
I believe the version you used here was the reconstruction assembled for the volcano paper without the variance-adjusting transform. There’s a bit of inference there, but that paper was the one cited by BO99. Do you have better information on its provenance?
Steve: Nick, as I’ve repeatedly told you, you are spreading disinformation about these datasets. Please stop making assertions if you don’t know what you’re talking about.
The caption to Briffa and Osborn 1999 says that the data was “processed to retain low-frequency signals”. This is nothing to do with the CRU variance adjustment tweak. The APpendix in Briffa et al 2001 discusses the method in Briffa and Osborn 1999 as well. See also Climategate correspondence in Sept 1999 discussing the First Order Draft graphic, which uses the same version as Briffa and Osborn 1999 (also deleting the inconvenient bits).
Nick, you say
Again, this is totally untrue. As I pointed out before, it is perfectly clear that there is negligible additional data in the B2001 data set. As a result of FOI requests a few years ago (and only after FOI) , lists of data sets used became available. See http://www.cru.uea.ac.uk/~timo/datapages/b01abd_site.txt and http://www.cru.uea.ac.uk/~timo/datapages/b98volc_site.txt for lists.
B2001 uses only 3 sites north of 30N not used in Briffa Nature 1998(393) – volcanic, plus 6 sites S of 30 N in Tibet. B1998 (Nature 393) uses 3 sites not used in B2001 – one of which oddly is Tornetrask MXD, an important series, where the Briffa reconstruction used the Briffa bodge to hide the decline (as opposed to the later CRU trick of simply deleting data.)
Your assertion that it is possible that B2001 used a materially different dataset is without any foundation whatever.
Steve,
“was age-banding, not Hugershoff, as you falsely allege”
I made no such allegation.
Steve: Did so though this may not have been clear to you because you don’t fully understand the techniques. You stated: “They compiled an average (which is what Steve found), compiled for that 1998 paper, which showed features which seemed to match volcanic eruptions.”
The 1998 paper used Hugershoff. You claim that the NCDC xls file (the one that I found) was compiled for the 1998 paper. I.e., that the NCDC xls used Hugershoff methods described in the 1998 paper. This is untrue.
It contained a different Briffa version, one that was applied (truncated) in Briffa and Osborn 1999, one that used age-banding.
My point stands.
Steve,
I made no allegation there of any kind, and certainly nothing about Hugershoff vs age-banding. I advanced a theory about where these numbers came from. I said it involved inference, and explained my reasoning. This was in a vacuum – following Fordprefect’s perfectly reasonable query about the provenance of the numbers that you found and used as the basis for the allegation (for which you still offer no evidence) that a section of the plot was deleted “to give the impression of “corroboration” of the “general validity” of the reconstructions.”. You made no comment on my theory at the time.
If you believe you know the provenance of the numbers you have found undescribed on a file and used, why don’t you straightforwardly set it out, with evidence, instead of making unsupported allegations about allegations.
Steve’s sentence
would be better (imho) as
This removes any speculation about intent.
oneuniverse,
It doesn’t remove speculation about intent – in fact the gallery here rarely bother with the speculation stage – going straight to judgment. But it does offer deniability.
Nick, you allege that “I don’t think he actually looked into the amount of data that was supporting the average.” This is untrue. In the post that you criticize, I observed:
I didn’t then observe, but do so now, that one of the three Jones et al 1998 proxies referred to above was based on a single site in the Briffa MXD network.
Re: Steve McIntyre (Mar 29 00:14),
Correct, I missed that. My apologies.
Nick, you wrote: It doesn’t remove speculation about intent [..] But it does offer deniability.
It does remove the speculation – in fact that’s all it does. And if it doesn’t remove the speculation as you assert, then how does it provide deniablility?
Roman M,
If you wanna call this:

Adequate spatial sampling then that is your choice but anyone can see pretty clearly that pre-1500 two regions would dominate the variability in the reconstruction. So considering 3 regions have a total of 3 series and 2 have a total of 21 series my criticism is quite justified. Would you using temperature compute a regional composite with that distribution of thermometers and call it accurate… not a chance!
To further my point:

Is the pre-1880 data in this graph reliable? Well no, but then why isn’t there an accusation of hiding inconvenient data? Well simply because the sample density is too low to include past whatever threshold. Yes the authors should have been more clear but this foray is counterproductive.
And for the record RomanM I know you have considerable statistical expertise but if you call that spatial distribution (pre-1500) as being adequate then it is your credibility on the subject that should be questioned, not mine.
It is obvious from that sample distribution that no full composite could accurately represent all 5 regions pre-1500. How can you defend your position by saying 4/5 regions are included? Yeah they are but 87% of the data comes from 2 regions. Bias much?
More evidence supporting my interpretation from Briffa 2001
“Bias might be introduced in cases where the spatial coverage is not uniform (e.g., of the 24 original chronologies with data back to 1500, half are concentrated in eastern Siberia) but this can be reduced by prior averaging of the chronologies into regional series (as was done in the previous section)… Eight different methods have been used… They produce very similar results for the post-1700 period… They exhibit fairly dramatic differences, however, in the magnitude of multidecadal variability prior to 1700… highlighting the sensitivity of the reconstruction to the methodology used, once the number of regions with data, and the reliability of each regional reconstruction, begin to decrease. The selection of a single reconstruction of the ALL temperature series is clearly somewhat arbitrary… The method that produces the best fit in the calibration period is principal component regression…
“…we note that the 1450s were much cooler in all of the other (i.e., not PCA regression) methods of producing this curve…”
Steve: in no way does this support your point. If the pre-1550 data was inadequate, then why did Briffa et al 2001 present a pre-1550 portion of their chronology? In my prior posts, I observed that Briffa et al 2001 had obtained a reconstruction with a greater rhetorical resemblance to MBH in the pre-1550 period using principal components and, then and only then, did they include this in their spaghetti graph.
I also observed that there are real issues in preferring a principal components based method to an averaging method, as lower order principal components flip chronologies upside down – hardly a rational procedure in the present application.
Steve,
The reason given in Briffa 2001 for their selection of a certain reconstruction is discussed:
>>> The selection of a single reconstruction of the ALL temperature series is clearly somewhat arbitrary…The method that produces the best fit in the calibration period is principal component regression…<<>>“…we note that the 1450s were much cooler in all of the other (i.e., not PCA regression) methods of producing this curve…”<<<
That to me pretty evidently shows that the reason they chose the PCA was because it provided the best fit in the calibration period.
I'm not saying PCA was necessarily the right choice but they give their reasoning explicitly. Insinuating it was chosen based upon fitting into a narrative is only hearsay when the authors clearly state why they chose that reconstruction.
Regarding the pre-1550 data they state:
“Bias might be introduced in cases where the spatial coverage is not uniform (e.g., of the 24 original chronologies with data back to 1500, half are concentrated in eastern Siberia) but this can be reduced by prior averaging of the chronologies into regional series (as was done in the previous section)…
That to me says they acknowledge it is not the best situation but that by doing prior averaging they feel they reduced their bias. Personally I think that they should not have computed a reconstruction prior to 1550 because of the lack of spatial distribution as noted here:

but they felt in the 2001 paper secure with doing so. We can`t be mind readers here but they gave their reasons right or wrong. You just have to accept that this isn`t the great conspiracy that has been presented.
Steve: I don’t use the word “conspiracy” – please don’t make foolish allegations that I did or make pointless strawman allegations. It is not sound statistics to select an inappropriate method merely based on calibration r2, particularly when the calibration period itself has apparently been tailored.
Whether or not they provided adequate justification for PC methods in Briffa et al 2001 is also immaterial to the issue of whether the deletion of data in Briffa and Osborn 1999 was done because of insufficient replication as defenders have alleged. if the replication was insufficient in Briffa and Osborn 1999, then it was insufficient in Briffa et al 2001.
No one has refuted this point.
Re: Ed Barbar (Mar 27 22:31),
Well, yes, in the Science paper a 50-yr filter was used. In the earlier Nature paper it was “bi-decadal”.
I don’t recall mentioning 1600. But data doesn’t suddenly switch from being reliable to unreliable. Going back in time there’s less of it, until you start to get silly results, as this post shows. At some stage, someone has to decide when to stop.
There is a paper by Briffa in Quaternary Reviews 2000 which goes into much more detail about the datasets. About one (Tervagatory) they say:
“Note that, although the whole series is plotted here, the authors consider replication to be too poor before 1550 to be reliable.”
Tervagatory is Mongolia (48N, 99E), and is irrelevant to the NH MXD series in question.
Nick said: “But data doesn’t suddenly switch from being reliable to unreliable.” but perhaps it can with trees. If a bristlecone is growing along and then is damaged along the trunk (lighting, frost damage, whatever), the remaining bark exhibits a huge growth increase (trying to repair the damage) for 100 yrs or so, which looks like a response to climate but is not. Same thing if a Yamal larch goes from shrub form to tree form. Or if sometime in the past many trees around the tree in question died, giving it more space. In fact, it is hard to find a reason to be sure that a given tree would remain a reliable proxy for an extended period.
Re: Craig Loehle (Mar 28 14:12),
Well, yes, I should have said something like “the (adequacy of the) quantity of data doesn’t suddenly switch…”
“But data doesn’t suddenly switch from being reliable to unreliable.” Except when it wasn’t reliable in the first place.
Re: Nick Stokes (Mar 27 22:12),
Steve,
Briffa 2001 references the Quaternary 2000 paper as the source. And I’ve given above the statement where they anticipate exactly that issue.
Ed —
The issue you raise is an interesting one. However, even a “50-year” centered rectangular filter extends only 25 years each side of the central value (if in fact 51 years are used to make it centered). However, a “50-year Gaussian filter” as was used by Briffa and Jones the 99 Science and RG articles is a clever bell-shaped filter that has a 50-year characteristic period (in terms of its half-amplitude, I believe), yet uses well under 50 observations, and hence can get even closer to the end without endpadding issues arising. So if Briffa indeed considered the pre-1550 sample size to be inadequate, he could have smoothed back to 1565 or 1570 without endpadding.
As Steve reported earlier, Briffa and Jones in fact endpadded in these two articles with the average of the last half-filter width, and hence Briffa smoothed back to 1550 after truncation. This is why there is a slight discrepancy in Steve’s graph between the Briffa smoothed values and his emulations at 1550 (and 1960).
Hu,
Thanks. I’m definitely no statistician, but I take your remark to indicate the pre-1550’s data wasn’t used, but some other technique, explaining the divergence between Steve’s full graph and the partial graph from 1550s – 1575. Also a compelling observation that the post 1575 data isn’t affected when pre 1550s data is tossed.
Steve – what if they had deleted the whole of “Briffa-Osborn MXD”? How valid would the graph be then?
I ask this because of a comment on WUWT by Leif Svalgaard in http://wattsupwiththat.com/2011/03/27/an-opportunity-for-online-peer-review/#comment-630524 L- “[…] Deleting all of Briffa does not change the result significantly, so that seems to be a reasonable thing to do. […]”
egrey1 —
Your WUWT link isn’t quite correct (click on the WUWT date to show a comment’s URL). Svalgaard’s comment is at http://wattsupwiththat.com/2011/03/27/an-opportunity-for-online-peer-review/#comment-630547
While it’s true that deleting the cherry-picked portion of Briffa’s MXD graph (which excludes the post-1960 decline with its undisputedly adequate sample size) wouldn’t make much difference for the HS impression, deleting or including the full graph (without without its pre-1550 portion) makes or breaks it.
It may well be that Briffa will defend exclusion of the pre-1550 portion in his Science article on the grounds of inadequate sample size, but that would put him on record that his use of this portion of the series in his 2001 JGR article, not to mention his Yamal HS, are also based on inadequate sample sizes.
I’ve posted this response here before, but I’d like to embellish it & repeat it again.
DO YOU KNOW HOW STUPID YOU LOOK? All the idiotic discussions of keeping some data, for what reason… Dispensing with other data, for what reason… Filtering the data using 20 years, 50 years, Gaussian…
You need to talk to some common folk at some point & all this discussion is destroying whatever confidence is left in climatology!
Second & this starts with Braffa, Jones & Mann: SHOW ALL THE UNCENSORED DATA FIRST! After displaying all the data, then you can justify leaving some data out, or all the data out, selectively cherry-picking for whatever reason, etc.
THIS IS INSANITY! How do you all expect to make any kind of cogent, understandable & more importantly, BELIEVABLE, argument of any temperature history in the public arena… if you keep machinating the data like you do?
In closing, let me respectfully submit, that you need to go from a highly advanced, scientific argument to a plebeian one. Us schlubbs here would like data & conclusions we can trust… not a bombast of “eye-rolling-back-in-the-head” renditions of “Uuuuugh… whad-he-say!?”
Anyone know what the rules for discovery are in Canadian lawsuits? Michael Mann has sued for defamation. http://www.courthousenews.com/2011/03/28/35274.htm
I would imagine that his records (including e-mails) will be discoverable or his case will be dismissed.
Michael Mann filed a defamation lawsuit in Canada claiming defamation. To me it seems like some kind of ploy to make it look like his science was truthful should he win the case. The case is about a claim that he should be or may be prosecuted for fraud and not about the science being truthful.
If the case was about the science, then why not file the lawsuit herein the US against all of us who do not believe his science and the proof posted on this website? Could it be because he can not prove defamation based on something that is true??
Prof Claims Climate-Denier Defamed Him
By DARRYL GREER
VANCOUVER, B.C. (CN) – A Pennsylvania State University professor claims climate-change denier Timothy Ball defamed him in an interview published by the Frontier Centre for Public Policy, a Winnipeg-based think tank.
Michael Mann, a professor in Penn State’s meteorology department and director of the university’s Earth Systems Science Center, claims that Ball defamed him when he said that Mann “should be in the State Pen, not Penn State,” for his alleged role in the so-called climate gate email tussle.
Mann says that Ball and the Centre refused to issue an apology and published the words with the “purpose of harming the plaintiff and exposing him to hatred, ridicule and contempt, lowering the plaintiff in the estimation of others, and causing him to be shunned and avoided.”
It’s not the first time Ball’s been sued by a climate scientist for defamation.
In February, Andrew Weaver of the University of Victoria sued Ball over an article published by the Canada Free Press, in which Ball allegedly accused Weaver of cherry-picking scientific data in his work with the UN’s intergovernmental Panel on Climate Change.Mann seeks punitive damages and wants the article removed from its electronic database. He is represented in B.C. Supreme Court by Roger McConchie.
Click to access ClimateGuy.pdf
Call me crazy, but… It almost seems like the tree ring data is upside down.
Seems they’ve taken a different tack over at SkepticalScience with their latest post RE: “Muller Misinformation #1: confusing Mike’s trick with hide the decline”
http://www.skepticalscience.com/Muller-Misinformation-1-confusing-Mikes-trick-with-hide-the-decline.html
“Lastly, it bears remembering that other research finds tree-ring density is reliable before 1960. Briffa 1998 finds that tree-ring width and density show close agreement with temperature back to 1880. The high-latitude tree-rings that show divergence after 1960 also match closely with other non-diverging proxies going back to the Medieval Warm Period (Cook 2004). This indicates the divergence problem is restricted to modern times.”
The sound of settled science echos on . . .
-barn
Funny how they would have known that in 1999…
Except that Cook doesn’t really believe in the accuracy of treemometers.
OT but congratulations on a hard fought loss to Boynton and Griffin in the finals!
Steve, your ongoing detective work keeps hauling me back to my PC to read the unfolding saga to the point where my wife is beginning to think I am becoming obsessed with Climategate. I am not, but you are creating the best detective story ever! The story has everything – bad guys, good guys, even the occasional clown makes an appearance.
Your efforts are amazing! Thanks.
The proxies fail in
Imitation of the mind.
What would Briffa say?
==========
Nick Stokes, and reply by Steve:
I think you mean that Nick’s claim not to have alleged that Hugershoff was used is untrue, not that it is untrue that the 1998 paper used Hugershoff.
This is just a minor point that I tried to attach to Nick’s post, but for some reason it doesn’t have the usual Reply link.
Another technical point — your inline replies are ordinarily bold face, unless you use more than one paragraph, in which case the subsequent paragraphs are not bold face. This sometimes makes it unclear whether you or the original poster is speaking.
Anyway, being US (N.Am?) runners-up in overtime ain’t bad! Congratulations to you and Bill! (I say N. Am, since 3 of the 10 teams in the ladder, including the winners, give Ontario as their origin.)
Picked this comment off of the financial post website. Certainly seems actionable to me:
Robert Davidson · Top Commenter · Lecturer in Composition at University of Queensland
Also Eduardo, how are you going to whitewash Steve McIntyre? He’s been caught lying too many times to keep count. Why on earth would you trust a joker like that, who can’t be bothered publishing his work in the proper channels, over an oft-exonerated team like that at East Anglia?
It really beggars belief. Until you realise that the wealthy, scared denial machine is really working, at least on some people.
Here’s a link: http://opinion.financialpost.com/2011/04/07/climate-models-go-cold/?fb_comment_id=fbc_10150153674648670_15596633_10150153989778670&ref=notif¬if_t=open_graph_comment#f2fa63a9654c5bc
23 Trackbacks
[…] Hide the Decline: Sciencemag # 3 […]
[…] when you think the bottom of the Hockey Stick rabbit hole has been reached, Steve Mc finds yet more evidence of misconduct by the […]
[…] […]
[…] Couldn't agree more MaxRange120 Meanwhile, more nails in in the coffin of those who are rapidly appearing to have been really cooking the books: Hide the Decline: Sciencemag # 3 Climate Audit […]
[…] Hide the Decline: Sciencemag # 3 The day before yesterday, I reported that Briffa and Osborn (Science 1999) had not just deleted the post=1960 decline […] […]
[…] Steve McIntyre qui a découvert ce nouveau scandale. D’abord un peu de […]
[…] El post de Steve McIntyre aqui. […]
[…] Hide the Decline: Sciencemag # 3 […]
[…] Källor här, här och här. […]
[…] have been some posts on the internet which have had my attention. First, is a series of posts by Steve McIntyre at Climate Audit that have led to another vastly expanded version of hide the decline. It turns out that […]
[…] the skeptic community had focused exclusively on the divergence occurring since 1960. It turns out another divergence was discovered by the irreplaceable Steve McIntyre this week. It turns out that Briffa not only […]
[…] when you think the bottom of the Hockey Stick rabbit hole has been reached, Steve McIntyre finds yet more evidence of misconduct by the Team. The research was from Briffa and Osborn (1999) published in Science […]
[…] when you think the bottom of the Hockey Stick rabbit hole has been reached, Steve McIntyre finds yet more evidence of misconduct by the […]
[…] iii https://climateaudit.org/2011/03/23/13321/ […]
[…] to avoid Freedom of Information legislation. There is truncation of data – this looks worse and worse as people dig into it. At some point the left are going to have to face up to the fact that the […]
[…] […]
[…] Climate Audit by Steve McIntyre Skip to content Hockey Stick StudiesStatistics and RContact Steve McProxy DataCA blog setupFAQ 2005Station DataHigh-Resolution Ocean SedimentsSubscribe to CAEconometric ReferencesBlog Rules and Road MapGridded DataTip JarAboutCA Assistant « Hide the Decline: Sciencemag # 3 […]
[…] the decline were discussed, including recent analyses of Briffa and Osborn (Science 1999) e.g. here. Following is a graphic showing Keith’s Science Trick – the deletion of adverse data […]
[…] frattempo Steve McIntyre attacca di nuovo uno spaghetto non incluso in una vecchia mazza da hockey, osannato da Climate Monitor; Anthony Watt è di nuovo smentito dal […]
[…] This smoking gun was discovered by the dogged statistical expert Steve McIntyre. [click to enlarge]. What the graph shows (in plain English) is how the purple data set was deleted from the equations (and graph) and replaced with the thick black data at the end of the series – which gave this chart and all its later version the Hockey Stick shape. Without that black blade sticking up in the air, there is no global climate emergency. […]
[…] Recently, following the revelations in what have become known as the Climategate emails, and some excellent detective work by Steve McIntyre uncovering precisely what “tricks” were used in the creation of the […]
[…] Just when you think the bottom of the Hockey Stick rabbit hole has been reached, Steve McIntyre finds yet more evidence of misconduct by the […]
[…] hockey stick graph. Recall how this graph, unfortunately, was created by poor mathematics , and by suppression of data showing very fast warming before 1550 and recent decline. The crowd didn’t care the image wasn’t logical. This graph formed […]